
It’s been a while since even the most committed perma-bulls – including the most optimistic apes from /r/wallstreetbets/ – have been silenced by the market, which has done nothing but producing lows followed by lower lows. And it’s been very clear, loud, and relentless at that.
Consequently, the new fad has been picking the bottom of this bear market. A dangerous proposition. And yes it’s been very traumatic for those who tried. Lots faces have been met with flying pies.
Personally, I’m not keen on picking a bottom anytime soon. Why?
Well it’s because of fundamental reasons of course, too many to list. There’s the US economy down the drain, China economy down the drain, EU economy down the drain. Freaking everything is down the drain.
And on the purely technical level, it’s because of this:

Know what this is? It’s two weekly charts of the S&P500. The one above is the index trading back during the 2007-2008 financial crisis. The chart below is from two days ago.
Both charts end before the Labour Day long weekend, which is when I’m writing this.
Note the uncanny resemblance between the two.
I’m reading the tea leaves here, but the two are more than similar. Both charts present us with same structures.
Let me list a few of those:

- The start of the downward momentum can be identified in October, respectively both in 2007 and 2021. In both cases there is a specific fundamental market turnaround.
- A first downward push “Impulse #1” happens, and achieves a 18% drop in 2007-2008, and 14% drop in 2022
- In both cases, the start of the retracement from the drop happens in March
- Also in both cases the retracement achieves a lower high
- Then a second downward push happens, “Impulse #2” , which causes a 14% drop in 2008 and a 20% drop in 2022. This isn’t looking good at all.
- A relief rally happens. In both cases the start of the following retracement can be considered a summer rally, starting with July
- And again, lower lows and lower highs are achieved.
In 2008, after the summer retracement and exactly after the Labour Day long weekend, the market participants started a downward movement which brought about a further 50% drop of the index. The event took 200 calendar days to unfold, and ended with clear market capitulation.
I am clueless about what the market will decide to do in the next weeks, and it’s clear that events in the past are not a reflection of what will happen in the future, but I have to note that:
- The 2008 financial crisis was a sudden deleveraging event accelerated by a threat hidden in the market (here is a refresher on Complex systems and Chaos for a systemic outlook at this class of outcomes)
- Today instead, the 2022 crisis is almost entirely manufactured by an insane liquidity tsunami adopted at the start of The Bug pandemic.
- In 2008 the world outlook was pretty quiet. Today there is a freaking kinetic war involving Russia, and another potential one brewing with China. This makes for a pretty inescapable wall of worry compared to 2008.
- The 2008 financial crisis was when the FED started printing money and lowered interest rates. Back then, that was a pretty effective market booster. Today the FED is forced to go in the opposite direction due to the insane rate of inflation. There is no way the FED will come to rescue a crashing market before inflation hits reasonable rates, and stays there for a while.
It can be argued that from many angles the market as a whole, today, is exposed to many, many more ominous predictors than it was in 2008. Back then there was basically just one. To use a more technical term, right now there is widespread belief that we are in very deep sh*t.
Many have reasons to say that this was a long time coming.
On top of that, the Friday’s session, which was accompanied by a nice short-covering rally (institutions closing short positions ahead of a long weekend), was turned around with a massive 2.71% drop. A desperate flight to safety which was heard by all assets. I think this was heard loud and clear by all participants.
Damage assessment before Labour Day long weekend
Institutions are generally expected to close short positions before a long weekend. They don’t want to expose their shorter term trades to any potential adverse news.
Last Friday instead, something different happened. There has been a generalized flight to safety. All risky assets have suffered heavy casualties, even commodities. (I had an open position in Cotton. I faced pies too).
Let me tell you: If this happens now, it’s because THIS IS BAD.
Tricky Dixy, the US Dollar Index, did a 180 and regained its previous high in basically a single hour. Massive flare up. This screams run to safety by the market:

As a confirmation of this, the T-Note bond yields crashed BIG TIME. 100 basis points lost immediately. Institutions started buying aggressively. Basically all money from stock market and commodities has been moved toward bonds in one swift move:
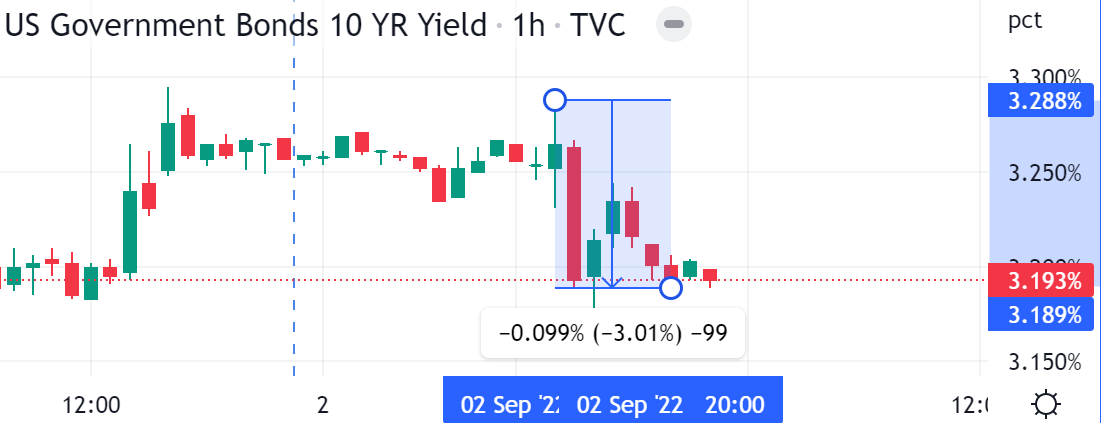
This move was heavily participated. USD was bought across the board in order to park liquidity in the safety of US bonds. Euro dropped almost 1% against USD. Basically no one wants to hold Euros, and for good reasons. The wall of worry for the EU is way too high, and yields way too low:

The inverted yield curve started signalled a will to return to normalcy. The 2-years US bond yields crashed against the 10-years, which I guess is good.
No, actually this isn’t good at all.
We all know what happens after the inverted yield curve heals. In case you don’t know: it signals recession right behind the corner:

How low can it go?
Well, one can only make finger-in-the-air predictions here. It all depends on how much liquidity the FED will ultimately leave on the table, and when the FED will pivot.
The market has been disconnected with reality for a long time now. It basically only reflects what the FED does. The FED isn’t printing money right now. There is panic and negativity. Therefore the market goes down. The market actors are fuelling its downward momentum because they now know that’s the only direction it can go.
At the moment we are still at valuations so high that no real price discovery can happen. We are still in panic mode, and I think this phase has just started.
In 2008, what follower the Labour Day pause was a resume of the downward movement, which was absolutely brutal. Today the market is way more leveraged than that. We have potentially a long way down.
How long? Let’s try to throw some random numbers.
Revert to the mean
I’m not a proponent of the revert to the mean hypothesis. The historic upward trend line (aka the mean) was established in 2008, and is a consequence of the never-ending QE by the FED. It isn’t necessarily representative of real economic conditions. That was just FED printing money and creating inflation.
Sure, if the FED resumes printing money, we can very well revert to the mean. At the time of writing this, with this scenario we are looking at a further 32% potential market drop.

Bad news: it’s way lower than here.
Again: there is really no real fundamental reason why this should happen. The trendline outlined in the chart is just a number the FED has manufactured. It really isn’t a reflection of real US economy.
But sure this may happen. And that would be, in my mind, not the likely outcome, but probably the best of the possible ones.
Previous support
This is also a meaningless prediction. But there are a few more technicalities why this could happen.
If the market happens to drop a further 46% from where we are today, it would find a previous resistance, which has already been confirmed being a strong support. During the 2020 sell-off, that happened to be the bottom.
Furthermore, that would mark a 56% decline from the all-time top. Which is the same overall S&P500 decline brought about by the 2008 financial crisis.
I repeat, there is no reason why this scenario, specifically, could happen. Except for the fact that sometimes events rhyme across time.
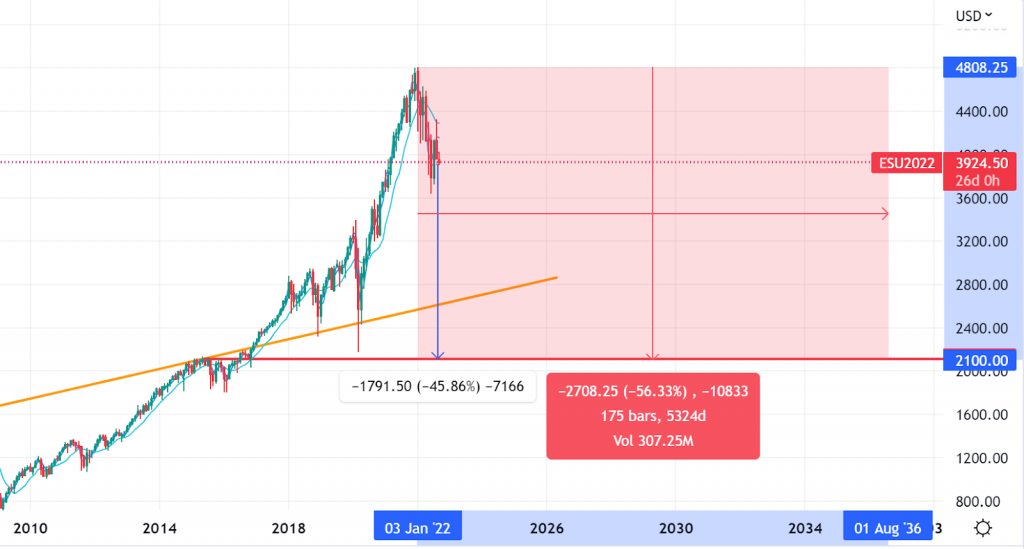
It’s waaaaaay down below.