

“Sacro, you have been raving about the Euro, and macro outlooks, and yada yada yada. But can we make some money off of this?”
Oh definitely.
“Will we make some money off of this?”
The hell if I know!
But you are right. Enough with the macro babbling. Let’s throw a bunch of technical stuff on the bench, then we sieve through it, and then we can try to make a case for both bullish and bearish outlooks.
It’s going to be messy, I promise.
“But this is a 5000 words wall of text…”
“I just wanted to trade. Is this really necessary?”

Table of Contents
- Important foreword
- Macro outlook
- Correlated assets
- Technicals
- Market psychology
- Scenario analysis
- Trade formulation
Important foreword
This is a trade manual intended for all audiences, including relatively fresh traders. It’s a map into a systematic process, to build a trade. And into managing it. The psychological aspects of it. Those of the people you are taking money from, or giving to. Everything, the whole package.
And these aren’t even easy trades, by the way. Today we will be looking at a bottom-picking one, and an overextended continuation. Two of the worst kind.

But regardless, here is one of the processes that I happen to like and use, in order to gain some guidance managing a very, very comfortable Forex position. A couch trade. And this is specifically for the currency market. Do not attempt to apply this approach to indexes, equities, commodities, utilities. This is only intended for the currency market.
I don’t even like Forex that much. It’s a messy, schizophrenic environment. But having a positive return on Forex is a valuable skill. Unlike stocks or bonds, the currency market is forced to always provide some volatility, and is direction-neutral. There are always some opportunities in it, regardless of the market environment. The same can’t be said for stocks or bonds, or metals, or anything else.
I fear this might be useful in the times to come. This makes up for a good first technical post in this blog.
This process is intended to produce speculative ideas for medium-term trades. Up to a few weeks in duration. Longer than that, it starts to become an investment. Shorter than that, it’s day-trading or scalping.
We can discuss those approaches another time.
This is a blog about finance that teaches stuff. Let’s take it easy: let me show you a process to make a couch trade first.
The process is a top-down approach and involves these steps:
- Macro outlook and recent changes
- Correlated and divergent securities
- Long time-frame technical analysis
- Medium time-frame TA
- Short time-frame TA
- Market psychology
- Scenario analysis
- Trade formulation, signals and entry points
“But Sacro, don’t these steps make total sense if applied to any security?”
Yes you are absolutely right.
“Then why limit this to currencies?”
Because my friend, the currency market is ripe with ginormous entities whose main problem in life is to exploit liquidity pockets to scale-in or scale-out of their positions. That means that they will actively seek to stop you out for a loss, before even considering doing anything else. And bits of this process try to account for that. This of course happens in any market to some degree, but the currency market is just ridiculous in that respect.
That said, we are going on a really deep dive. On EURUSD. Buckle up.
Macro outlook
What’s going on, on the margins of this pair? Let’s look at the latest news!
The ECB did something
The ECB raised interest rates to zero (no joke), doubling the size of its expected hike, and ending at least on paper a shameful era which went on for years. In theory this is a stricter environment for the Euro, and that should diminish the haemorrhage of value in the currency. It’s still far from enticing institutional investors into buying Euro-denominated bonds, but it’s at least a reduction of value push in the opposite direction. It’s something. A solid point for the bulls.
The FED did nothing (unexpected)

Papa Jerome held the FOMC press conference where a 75bps rate hike was confirmed (transcript), dispelling fears of a 100bps increase. Commodities immediately reacted to what was interpreted as a dovish move on the FED’s part. It’s weird, if you really listen to what he said, he wasn’t that dovish at all. But I’m booking a point for the bulls, at least for now.
The EU is not in a recession
The EU managed to dodge a technical recession essentially thanks to France, for a change. This in turn re-ignited a marginal attention on EUR denominated assets, which are to be repriced higher. Point for the bulls.
Correlated assets
T-Bond yields

Uncle Sam’s pockets. What’s going on here?
This is the big driver. There is some buying into US bonds at relatively low yields. Let’s not make the mistake of labeling this as optimism. It’s just institutions parking their liquidity temporarily until the next bond maturity date. But this gives us some leeway: yields are down.
Falling yields are good for the EURUSD pair. At a systemic level, higher yields stimulate the purchase of USD in order to allocate value to the safe haven of US bonds. Therefore, upping the supply of other currencies, which are sold to buy USD.

The point here is that, at least for now, no more EUR is being sold at breakneck pace, in order to acquire US bonds. The haemorrhage has somewhat stopped. Temporarily.
The important thing to notice is that despite the upward pressure by the FED, yields broke below 2.7% which was a tested support. Anything may happen now, perhaps we see a new lower high and then down again.
Reactions are expected around 2.5%, if the chart gets there. Not likely, but let’s see.
In the very short term I’d say go ahead for the bulls, not because of the technicals of this chart, but instead for the significance of it.
Important: Looking at the chart, one can argue it has a bearish head-and-shoulders pattern in it. It’s true but please don’t try to see a long-term movement into it. Or even a medium-term one. There is no optimism going around in the market. There is instead upward pressure by the FED, which is going to raise interest rates later on. Inflation it’s still here. Time is ticking. It’s gonna happen.
US Dollar index response
The strength of the US Dollar against a few others. How is it? What’s going on here?

The US Dollar chart is very interesting. It is now resting at 12860, above the MM50, which is also a recent support. MACD definitely is showing some downward pressure, while the RSI still has some room before flashing an oversold signal.
The reaction to the latest development from the FED has shown a very bearish response.
Markets, especially the tech area, are starting to be hurt from the strong dollar.
Perhaps the US Dollar will break below this support line. Too many corporations are begging for this. In that case let’s see what happens.
Note that the index touched the MM50. A reaction might happen here. This could shake EURUSD to the downside, maybe temporarily. That could prove to be a good entry point for EURUSD bulls.
Gold
Gold, the metal. The safety asset. What did it do?

Well gold – we are looking at the ETF here – did definitely stage a rebound, around 158. It almost matched a previous low established in March 2021, and it seems that it’s ready to take off again.
Gold raising means many things, but if there is no panic and the market isn’t reacting to an immediate sense of danger, it’s a signal of weakness for USD.
Always, always look at what gold is doing. It is heavily manipulated by some of the worst people, truly the scum of the earth. Those aren’t easily fooled.
VIX
The VIX Index, the fear tachometer. What happens here?
Ok, ok, the volatility of S&P500 isn’t always correlated to the strength of US Dollar, but it can be a gauge of troubles ahead, in the short term at least. And troubles often call for safety, which means the US Dollar gaining in strength.

The VIX seems to want to go below the MM200. Actually, it’s been a long time since it has been seen trading so far below this level. The index shows signs of wanting to approach 20, which is often assumed to be the transition between an upset market and a smooth one. It means nothing, other than it’s a psychological marker.
I am going to book this one as one solid point for the bulls. Let’s see if this chart cools down, so we can have some kind of summer rally in the stock market too. EURUSD would benefit from this.
Technicals
And now for the part that you have probably been waiting for, the technicals! Technical Analysis. Drawing things on a chart! That stuff.

Weekly chart
Here is what happened, since last time we looked at the weekly chart of EURUSD:
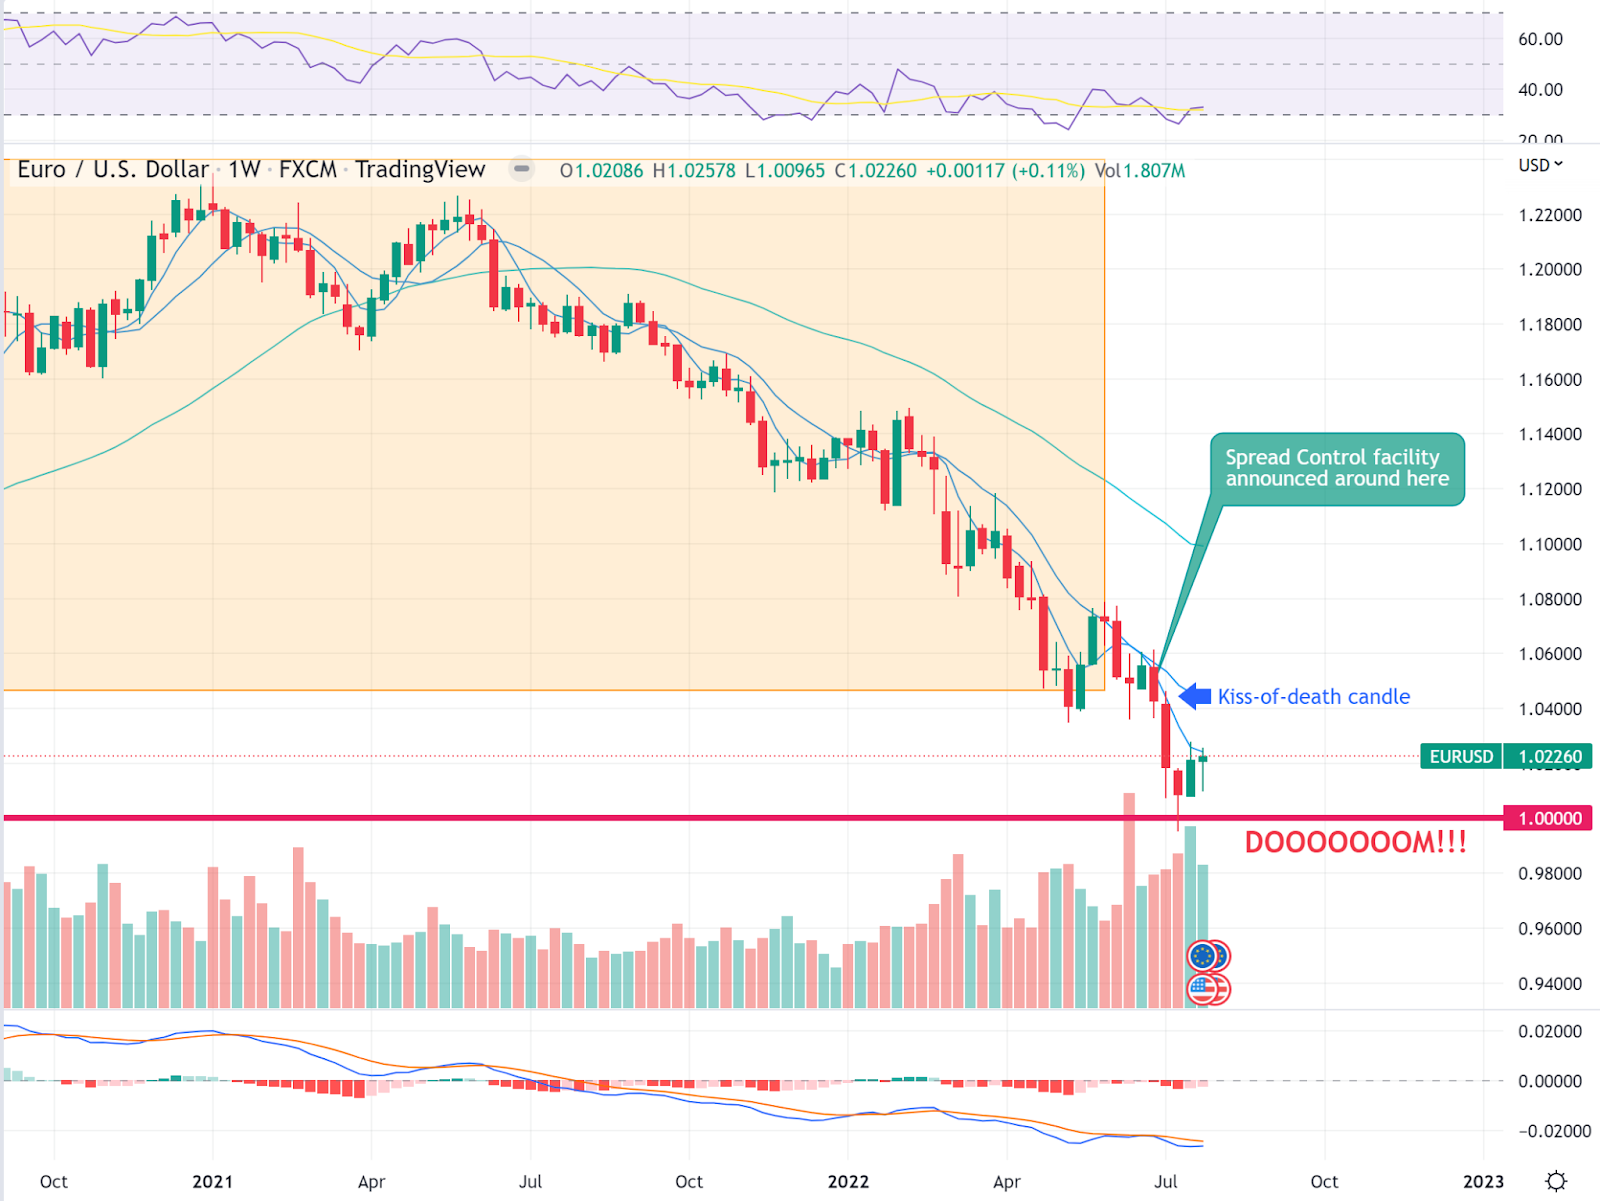
… not much, really.
MACD has been ranging below the signal line for soooooo long, and it appears ready to signal a ceasefire. Furthermore the RSI is starting to show signs of being oversold.
Last week’s candle is in range. I don’t like to overanalyze candlestick patterns: I’m going to mark this one with “nothing worth mentioning happened”. Which is very good news if you think about it.
There has not been a new low after the last bounce.
Yay, I guess?
I spoke about this teenzy-tiny little bounce, there to prevent EURUSD to close under the parity psychological level. Price action has been entirely muted, and Euro is still trash. Nothing more to say here, let’s move on.
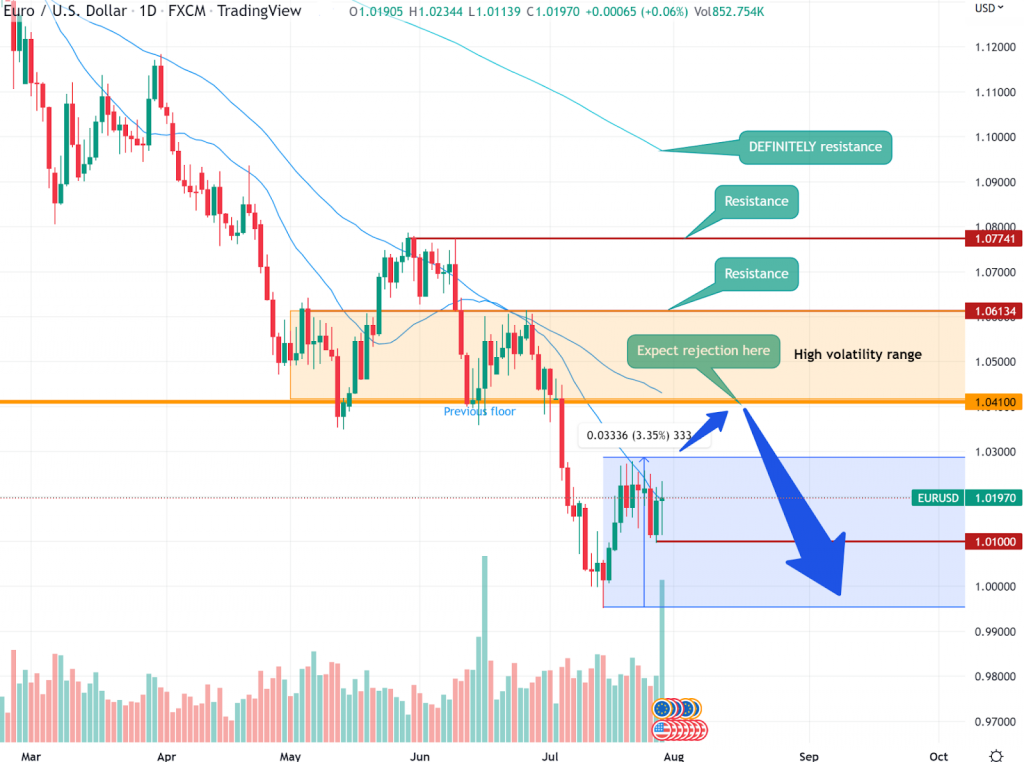
Daily chart
The daily chart. What happened here?

Here are a few things I’m noting:
- We are stuck within a range, low 0.995, high 1.027
- New recent higher low around at 1.01 still has not been violated, which is good
- Price was able to close above the MM21, which is good, but this happened multiple times before and means nothing. Closing above MM50, that would be a noticeable achievement, but it’s still very far high above
- Volume is growing on UP days, which is good
- RSI has left its oversold condition, which is something
- MACD is showing signs of something that could prove to be a pullback being in place, which is good
Right now, if the pair decides to trade higher, I would expect a reaction around 1.041, which is the convergence of several things:
- MM50, which is around there at the moment
- The previous floor, tested multiple times (which is now a resistance)
- The starting point of a powerful bearish movement that broke the floor on 5th July.
Closing above 1.041 would be a very strong signal for a medium-term long trade. I would definitely scale-in a long position at that point. Let’s see what happens if we come across this level.
Lower timeframe
The 4-hours chart. What’s going on here?

Well, it looks like a bounce is underway.
The range is clear. There is a good 1% of price distance between the ceiling of the range and the next resistance, which is the previous floor at 1.041. That one is going to be the very big one.
1.041 is going to be a make-or-break moment for the pair. Note that also the MM50 is resting right at that level.
RSI is neutral, and MACD shows no clear momentum. They are not useful right now.
Can we say anything nice to the bulls? Those poor, shaken, traumatized souls?
Well, for now we are resting above the MM21, which is almost nothing, but *almost* is important in this specific case. Most importantly, the higher low at 1.01 hasn’t been violated yet.
This gives us at least some clues on where to look for reactions and confirmations.
Market psychology

Let’s look at the abridged version of the daily chart.

“Price went down, hit a wall, and retraced”. That’s all that the price action is saying to us right now.
I wouldn’t call it an inversion. There is no upward momentum to be seen. No capitulation at all.
Gut feeling says “price is going down”. Which might of course prove to be correct anytime.
But this hasn’t happened yet. Why? Right now the players are saying:
Ok, we went down as far as 1.0.
EURUSD market movers, Aug 2022
And then some.
It’s a new, historic low.
We’ve been short for 12 months. We’re done.
Any buyers?
Anyone?
Sooner or later, if no buyers show up, the shorts will regain control, and will drive the price further down. That’s what happens when a “bear flag” plays out. Which is something that up to this moment fits perfectly over this chart.
But there is one buyer. The ECB is going to fight before seeing the parity broken. It has some USD reserves that can be sold to keep EUR afloat, and it’s not the only entity that might decide to join the ring. Perhaps below-parity is where the next battle will take place. But we are slightly above parity right now, in a trading range which so far has been devoid of drama. Operators know that below parity, lies the dragon.

Furthermore, a common market scenario is: when the price breaks below a major price level/trend/average, then market movers will want to move toward, or restore, that level. This predictor is so reliable that it might fall in the 90% percentile of the good calls. It might happen this time too.
Like any other strongly statistically-backed moves, the prophecy tends to be self-fulfilling. Movers expect 1.041 to be touched again.
What happens next has yet to be decided, but for now the important bit is that any price dip has a larger probability of being bought, by players that expect the price to rise, albeit for a relatively small number of pips.
To further reinforce the bullish short-term and mid-term scenarios, we have a considerable volume of old shorts, who are sitting over massive gains today. Some of those might consider 1.0 to be their target, perhaps they are aware that under 1.0 they might be welcomed with pies to the face.
And maybe some of those want to scale out. Their offloading might restrain any price dip, because it’s a valuable exit point for them, but I wouldn’t count on this too much. Large movers often cause capitulations in order to exploit their momentum and gain an entry, or an exit. The volume of retail and day-to-day institutional market makers isn’t anywhere near what the whales require in order to scale their position right away. Not even close.
Scenario analysis
The bearish case
Which brings us to the point I’m making since the start. Unfortunately, one of the high-profile guests decided to not join the party so far. The bullish story is missing a key piece.

The narrative in the chart is missing a very high-volume, overly stretched hammer or dragonfly candle. A tell-tale sign that often coincides with market capitulation, and that defines the start of an upward movement.
I mean yes, there is also that tiny hammer candle on 14th July, the one that briefly broke below parity. One can call that an inversion candle, but the fact is that after months of freefall, I’m not convinced that that one tiny reaction, with limited volumes, would be nearly enough to allow market movers to switch sides and gain liquidity for a somewhat sustainable upward movement.
I’m not saying we aren’t at the verge of seeing an upward move, but I’m convinced we need to see at least a few more stop hunts, before we see a trend that can sustain itself for a while.
After all, the short side is very strong: Look at the few high-volume green candles on the daily chart, such as the ones on 16th and 21st Jun. What did they do?

They didn’t do s**t, that’s what they did.
The short open interest is mind boggling here.
This compounds with the long term macro outlook for the pair, which is largely unchanged. I mean, yes, the FED might opt for a more dovish attitude in the next meetings, restraining future interest rate hikes, but I wouldn’t count on it. Inflation is still there. Commodities are still expensive. Rate hikes are coming.
The BCE might also decide to drive rates higher, because it now has the TPI tool to avoid internal bond yield fragmentation. But the market effect of the TPI is basically the same as QE, which unfortunately diminishes the value of EUR as an asset. I explain this in detail here.
All of this compounds into a forecast for future decline of EURUSD.
In the long term.
If nothing changes.
The bullish case
Which brings us to the bullish case. Long term bear markets are peppered with bull runs. And they often show up as rip-your-head-off rallies. Wouldn’t it be nice to nail one of those?
Here is what, right now, is compounding to embolden the bulls:
- The pair has seen a spectacular decline so far. At some point it must retrace.
- The Wall of Worry over the EU today is skyscraper-high, at some point, at least some good development is deemed to happen. That would cause short covering and an overextended upward movement.
- EU somewhat stopped the bleeding of value for EUR
- FED didn’t surprise with an oversized rate hike
- EU dodged a technical recession this quarter
- The weekly chart is showing signs of being oversold and MACD shows signs of abating downward movement
- Last weekly candle established a range that so far hasn’t been violated
- There is some buying, happening below parity
- The pair traded above MM21 without strong rejection
- Some shorts may want to cover and buy any dips that show up
- There is the 1.041 level overhead, acting as an attractor level
- Volume is up on green days
- Gold is signalling weakness on the USD side of the pair
- T-Bond yields are cooling down temporarily
- US Dollar strength needs to recede. It’s hurting earnings for the big techs.
- VIX appears to be moving toward the quieter quadrant of the chart
Note that no entry in this list qualifies for a long-term scenario. Some of those don’t even qualify for a medium-term forecast.
But one has to argue that bulls might be emboldened to move the price higher. Temporarily. They can at least try.
Of the two, bullish and bearish, this one is the scenario that I think fits a couch trade best. Not because I don’t expect EURUSD to decline in the future. I definitely do. But because the pointers lead us to speculate that an upward movement is ripe to happen, in the next few days or weeks. Days or weeks are the best life expectancy for couch trade. The price action is just in need of a trigger event.
Trade formulation
On managing oneself, and trade positions
What follows are some notes about the scaling-in into a trade position. With this style of entry, you are likely to see red for a while. Keep stops loose. Don’t go with big leverage. Keep a minimum margin of 15%, and I mean this for the brave. Anything beyond is danger fuel.
Some unregulated brokers allow retail traders to get in position with 0.1% margin, which means 1000x leverage. Those people belong in jail.
Make an exact worst-case estimate of your potential loss with the stop and entries you have planned. Make it RIGHT NOW. If that amount of money is too much, trade lower. Do not tighten the stop to make up for that.
The moment you place the trade, that money isn’t yours anymore.
Sacro. Every Tuesday, since 2010.
It’s gone. Forever.
It’s a stake in the market now.
Make up your mind:
It doesn’t belong to you anymore.
If, doing the math of your case, the reward isn’t worth it, then you are undercapitalized. I repeat: Do not make up for that by giving in to tighter margins. You can paper trade this instead. It has educational value if done properly. Bottom-picking, and continuation trades like the two outlined below, are always educational and nerve-wracking. It’s an exciting trade even on paper.
At some point, if and when the position is fully in place and it has produced some meaningful profits, you may want to move your stop loss at break-even. It is an option, and it is wise. In case anything bad happens.
Be mindful that acting this way means that you are in for a big-or-nothing trade. Those carry a different psychological payload than win-or-lose trades. You will have to manage the urge to close the position while in profit and loss is averted. It’s a much, much more sneaky psychological process.
All I can say to you is well, the philosophy behind any couch trade, really:
- You put down the effort, and did your research.
- You did the math, and managed your money and your risk responsibly.
- You placed the alerts.
- You placed the trade, and then the stops.
Then close the platform and join the couch. If you are of the restless type, set a periodic 6h timer. Do not look at the position before the timer, or an alert, rings.
Long trade
We want to try and make some money on the upside. How do we go about it?

Well, the very first assumption we are making is that sooner or later, but sooner than later, 1.041 will be touched again.
At the time of writing the pair is trading at the top of the range. If you are bold enough, you can make a first entry in case the price breaks above 1.027 and doesn’t immediately retrace. Let’s say it holds for 6 hours. That’s your signal.
But you are probably going to see a lot of unnecessary red this way, so hear me out.
It’s best to structure this trade in lots. Let’s say you plan to scale into the trade in a maximum of 4 shots, 25% a pop. But it’s your take, so go wild.
- One entry is obvious, which I already told you.
- A second entry would be on a reaction to reaching the MM21. If the reaction happens, go for it. It’s your signal. If instead the price pierces right through without even noticing, don’t bother. Allocate another 6-hours observation time for this event.
- Another entry would be at 1.01. It’s a noticeable level. It’s 1% above parity. It has been respected once, it may be respected again. If the prices falls there and retraces, it’s an entry signal.
Below that, there is parity. I would be very, very cautious here. Powerful entities unleash their might around this level. And too many makers put their stops there or right below. I would just sit tight and see what happens. Let’s elect an arbitrary 1%-below-parity price range as a designated battleground. I do not want to go near the pair if it’s trading between 1.00 and 0.99, and then some, for good measure.
- If the price goes there and there is a clear sign of rejection, then it’s ok. It’s an entry signal.
But obviously any decisive breakage of this floor spells doom for the bulls, and the whole plan in that case is scrapped.
You now know where to place your stops.
Trade management
If the price goes away from you, don’t chase it. If you have some position in place, good. You are making money. Manage the trade. There will be other entry points.
In an upward movement, the pair is likely to revisit 1.041 soon.
If, and when the price crosses 1.041, you will have 2 choices:
- Exit the trade. Expect a rejection. Your stake is off. Depending on how your entry played out, you booked gains of 1 to 3% on your stake. Congratulations.
- You remain invested. If you decide to hold, there are two scenarios:
- The price is rejected and promptly drops (likely).
- The price pierces right through (unlikely, but if that happens then it’s going to be loud).
In case (2) what you want to look for is the formation of a new low. That is a new potential entry point. Depending on the money management of the trade, one might want to consider this moment to scale further into the trade.
The bad outcome
Be prepared to lose. This trade is a form of bottom-picking. It’s difficult. It often fails. It is a craft in which the winners are those who best who know how to lose.
If the price falls, and pierces below 0.99, do not count on capitulation. Don’t average-down. Exit the trade. You can re-enter later. Make up your mind on a stop price and, by the love of God, if the price gets there, liquidate the position right away. No waiting for another candle. No moving the stop.
Close.
It didn’t play out. It’s nothing personal. Accept it. You will make up for that later on.
In this specific condition I would also make a case against using limit stops, because in case of an explosive move, your close order can and would probably be left unfilled. If you are not there to manage it, it’s a disaster. Please use market stops. This is a very liquid market. If your broker isn’t cheating you, it will give you a good fill regardless. Trade lower if slippage is your concern.
Short trade
What to do in order to make money on the downside?
Well, the bears have lots of opportunities. This is a trend that has been grinding money for them. They are not afraid to add on to their positions. This paragraph is going to be shorter and simpler than the one for the bulls. Why? Because continuation is the statistically most probable outcome in any trend, and they are simpler to pick.
In case the pair starts to trade higher, shorts will probably try to push it down: the previous lows are the target.
Same drill as before. Structure the trade in a number of lots. For the sake of this example, let’s make 4 of them, 25% a pop.
Right now there is no signal. The movement is overextended. It needs to consolidate before moving further down, if that even happens.
- The first place where to look for a reaction is the previous floor at 1.041. That is where the price is likely to be rejected first.
- Next up, there are two technical levels at 1.061…
- …and at 1.077. Both are potential turning points.
As always, if the price gets there, allocate an observation time window. If the price lingers and backtracks, it’s your signal to make an entry.
The big one is the MM200. That average has worked as a reliable resistance for a very long time. If the price gets there and retreats, it’s a major short signal.
Closing above the MM200 would be a major win for the bulls. That tells you where to place your stop loss. Do not skimp, leave some leeway above the MM200. One might also consider a structured stop that acts on the close of the trading day.
Trade management
I want to be clear: your target as a bearish couch trader is 1.0. Parity.
If the price gets there, you have two options:
- Expect a bounce. Exit the position. You made some money.
- Expect a further decline. This one is going to be messy. It is entirely possible for a massive down movement to manifest itself. Otherwise, strong rejection with powerful buying is likely to happen.
In case (2), if you want to stay in the trade and see what happens, consider putting the stop loss at breakeven.
Below parity, there is basically nothing. No technical levels, nothing. It’s uncharted territory. I guess in this case price action will dictate when to exit the trade. I will update the post in case we get there.
The bad outcome
If the price climbs above the MM200 and it’s not rejected right away, it’s a sign of strength for the bulls. They win. The plan is scrapped. You had your run and had a bad call. It happens. Close the trade and look for another one.